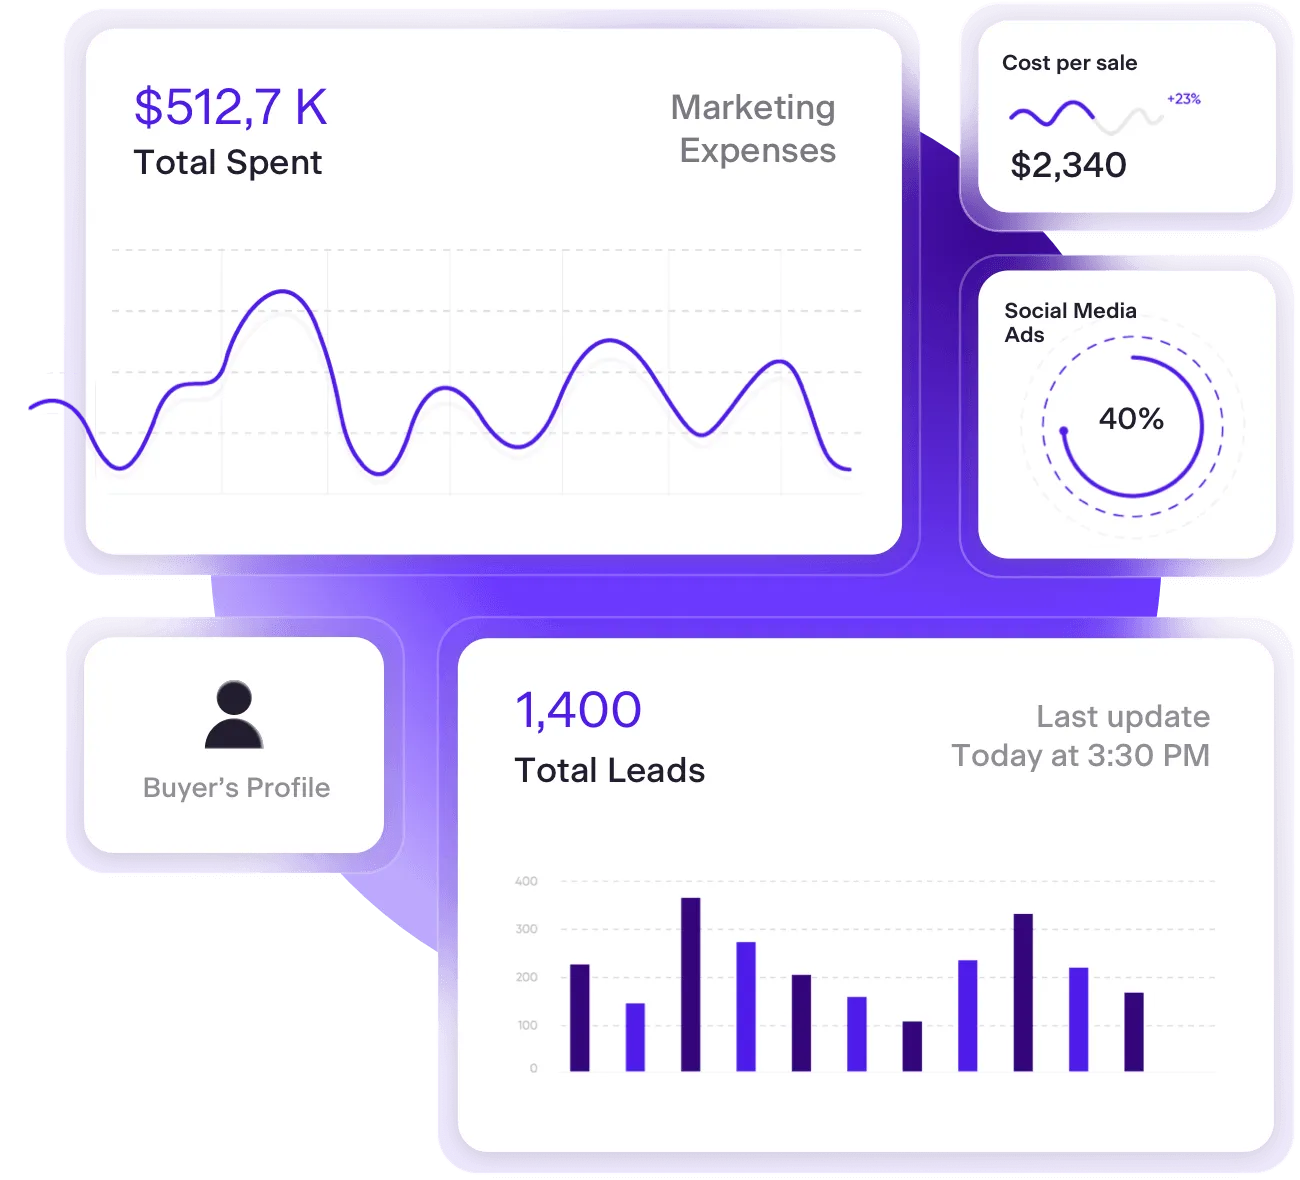
Dashboards and reporting

Real-Time Insights & Analytics for Smarter Decisions

Track sales, marketing, and operations KPIs—all from a single dashboard built for modern real estate teams.

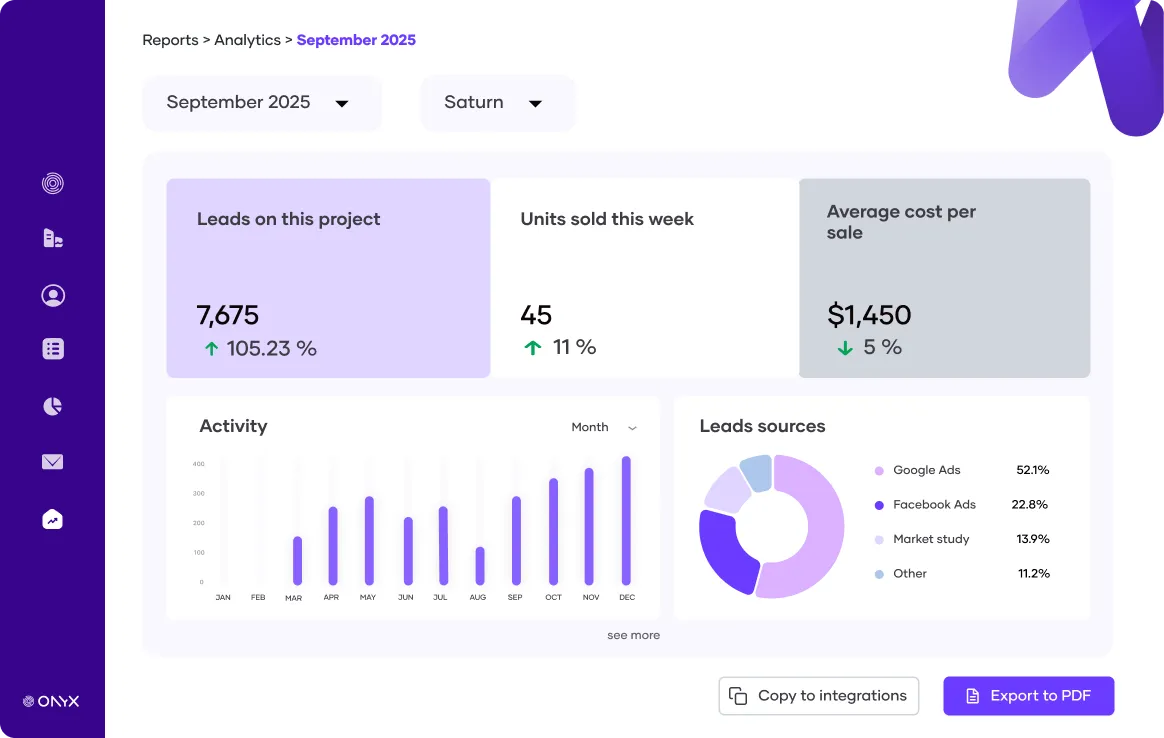
Onyx advanced analytics dashboard

Turn your data into real estate action

Stop relying on scattered spreadsheets or siloed reports. Onyx gives your team a single source of truth across sales, marketing, leasing, inventory, and after-sales operations.

Track ad spend, monitor pipeline health, measure leasing velocity, and leverage AI-driven recommendations—all in real time.
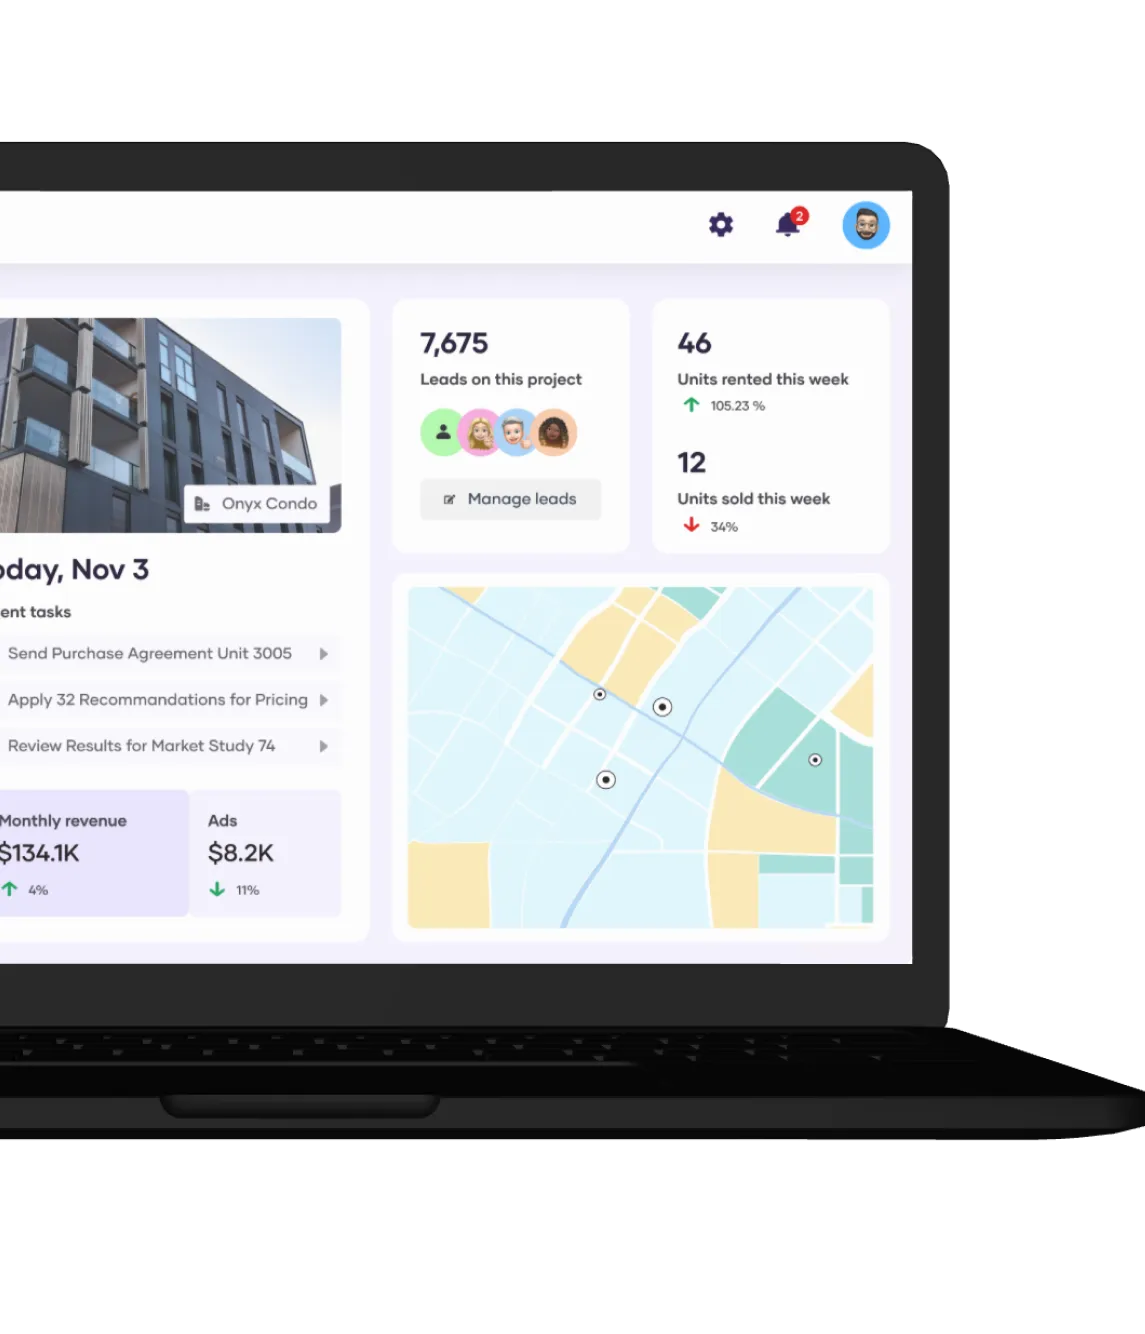
Onyx platform dashboard interface screenshot
Centralized KPI tracking

Monitor all your metrics side-by-side: sales revenue, absorption rates, conversion ratios, campaign ROI, lead sources, unit inventory, leasing velocity, and occupancy trends. Get the full picture at a glance—no toggling between platforms.

Ad tracking and ROI attribution

Connect ad spend directly to sales outcomes. Measure ROI per campaign, channel, or broker network, and optimize budgets instantly. AI highlights underperforming channels to pause or adjust for maximum efficiency.

Customizable dashboards

Drag-and-drop KPI widgets and filter by project, property, timeframe, or sales stage. Role-specific views ensure executives, project managers, and on-site teams see the metrics most relevant to their workflow.

Real-time analytics, reporting and alerts

Dashboards update live. Spot inventory bottlenecks, lead drop-offs, or low-absorption units instantly. Receive alerts for anomalies or opportunities and compare performance against historical data or market benchmarks.
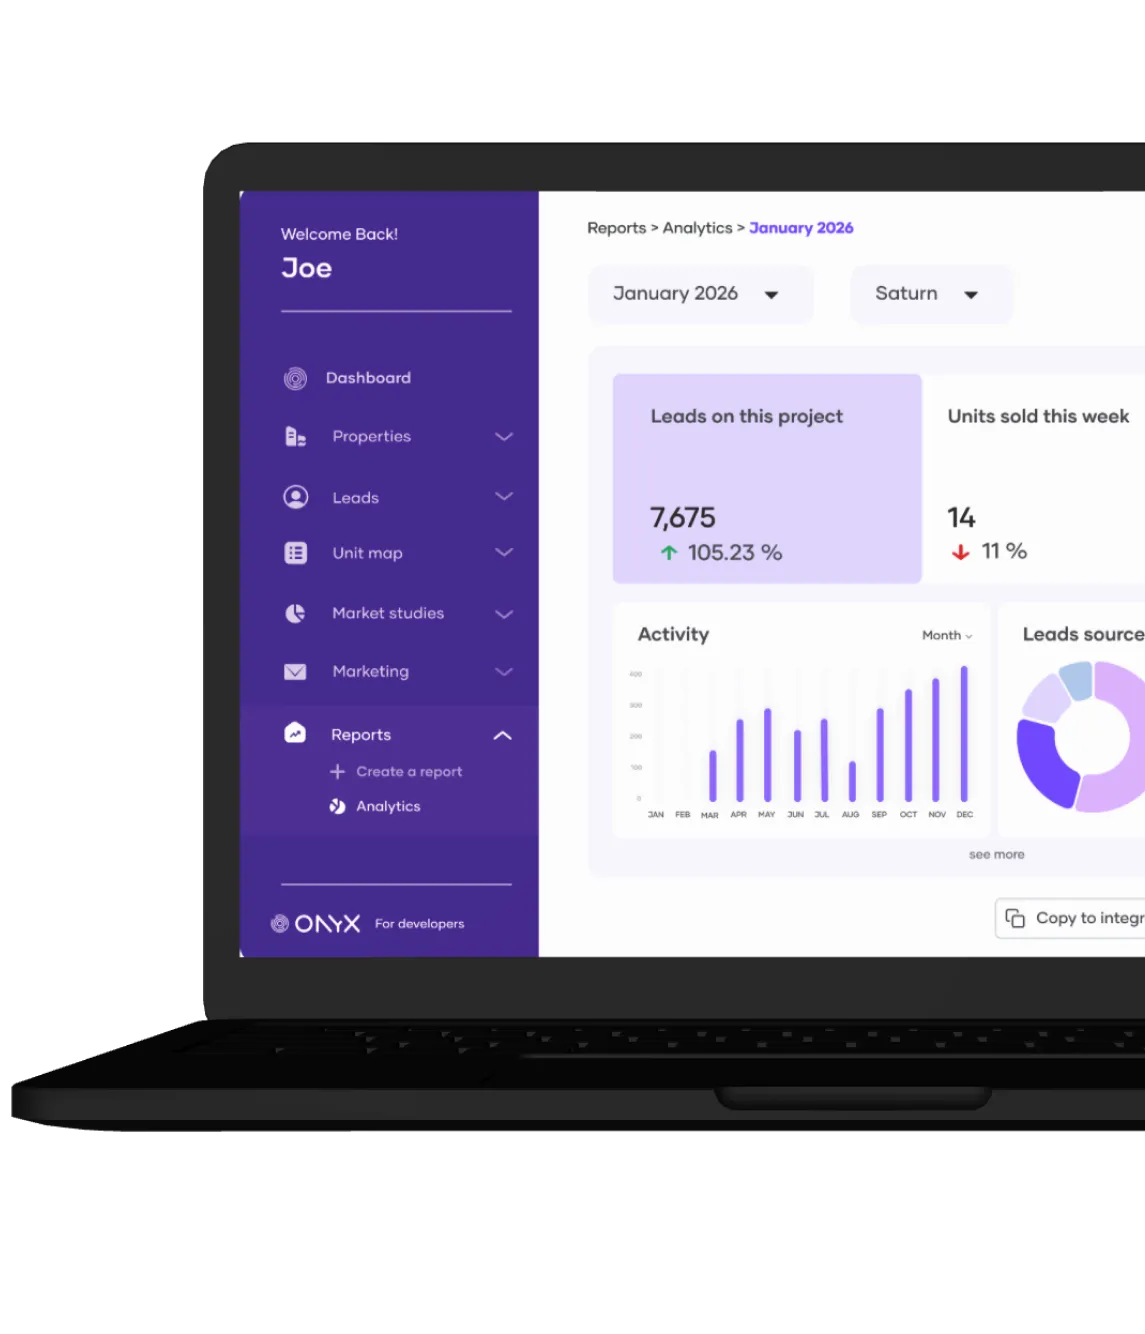
Onyx platform dashboard interface screenshot
Onyx analytics and business intelligence dashboard

Pre-Advanced analytics
& BI integrations

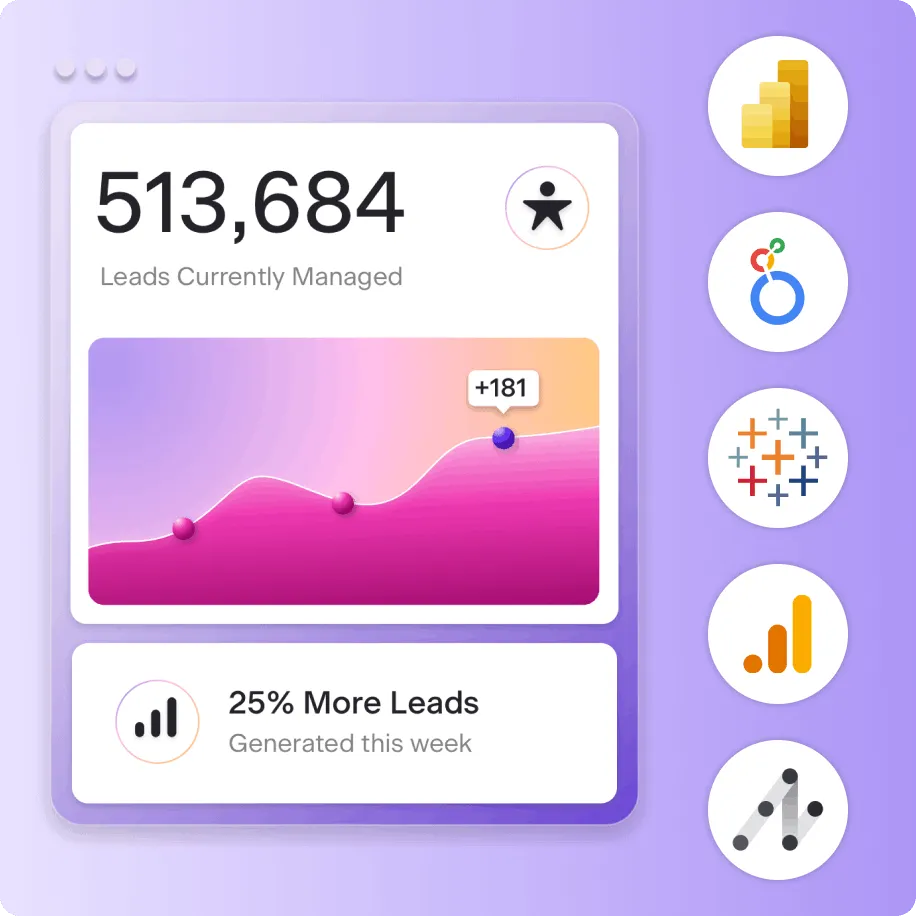
Onyx's analytics engine lets you slice data by project, unit type, broker, campaign, or timeframe, surfacing the insights that actually drive revenue decisions, not just reporting on the past. Your data stays unified, structured, and always export-ready. Connect your tools for deeper analysis.
Power BI
Tableau
Looker Studio
Google Analytics
Meta Ads
Tiktok Ads
Google Ads
Book a free demo

Are you ready to see your data in action?

Experience how Onyx dashboards turn raw real estate data into clarity—and clarity into growth.
Schedule a personalized demo →
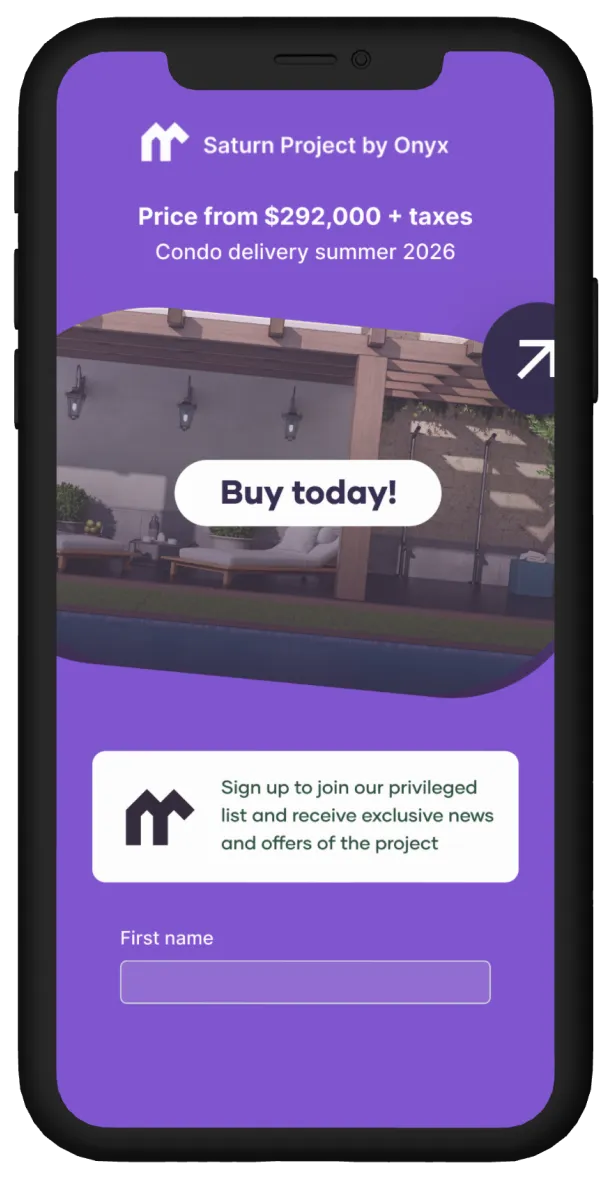
Dashboard mockupiPhone mockup
FREQUENTLY Asked Questions on analytics and reports
ONYX NEWS
Read real insights
from real estate pros
T-Minus 8 Weeks

Your Fall Launch Is in 8 Weeks. Is Your Pipeline Ready?

Eight weeks sounds like a long time until it isn't. Here's the honest operational checklist for developers preparing a fall launch — from lead list quality at T-8 to digital infrastructure at T-2.
Charlotte Grandjean
September 1, 2026
5 min read
AI Does the Homework

Real Estate Has a Homework Problem. Here's How AI Does It For You.

Market analysis, lead scoring, campaign reporting, renewal rate tracking. Every real estate team knows they should do it. Almost none have time. Here's how AI changes that equation permanently.
Charlotte Grandjean
August 25, 2026
5 min read
The September Edge

Back to School, Back to Market: Why September Is the Most Underrated Month in Real Estate

September consistently ranks among the highest-transaction months in Canadian real estate. Most marketing teams are still running their summer content. Here's what the teams that capitalize on it have in common.
Charlotte Grandjean
August 11, 2026
5 min read